The world of metrology is changing and 3D scanning for measurement and inspection is now used across a broad range of industries as a preferred method of obtaining accurate 3D data for a wide range of applications.
Data captured by 3D scanning is full field, meaning it covers the entire surface of the component. This enables The 3D Measurement Company (T3DMC) to provide a comprehensive inspection and analysis across the entire surface of the part. The reports produced using 3D scanning provide powerful data which can be used to evaluate the performance of the component across the complete surface and when you compare this with traditional single point tactile measurements; the full surface data contains far more detailed information which can be presented in a simple and easy to understand format (see examples shown later in the article). Further advantages of 3D scanning includes vast improvements in measurement process, almost complete removal of fixture requirements, significantly increased flexibility and portability of measurement.
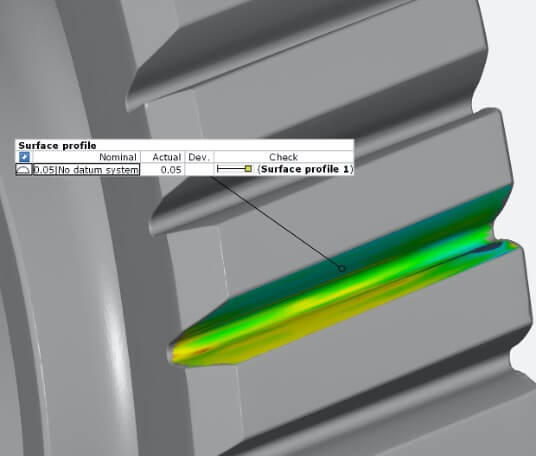
T3DMC uses the 3D scan data to create colour plots (or heat maps as they are sometimes referred as) to inspect the full surface geometry of the component. The scan data can be used to create a detailed report which can highlight the deviation of complex freeform surfaces, geometric elements and GD&T features against the CAD nominal or the master sample. The output from this detailed inspection is a visual reference in the form of a colour plot which is very easy to interpret and understand especially when compared with the complex and lengthy tables of XYZ data which are the common output from a CMM inspection.
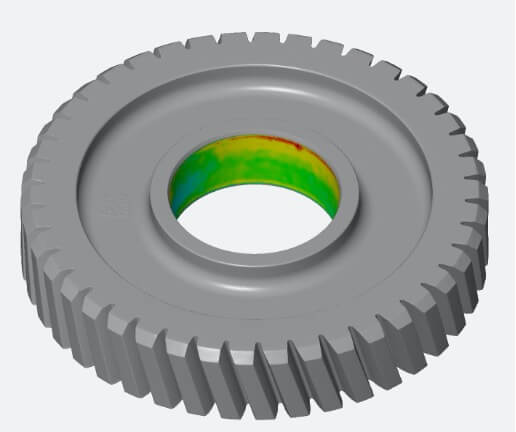
Below is an example of the benefits of a full surface colour plot for an automotive gear:
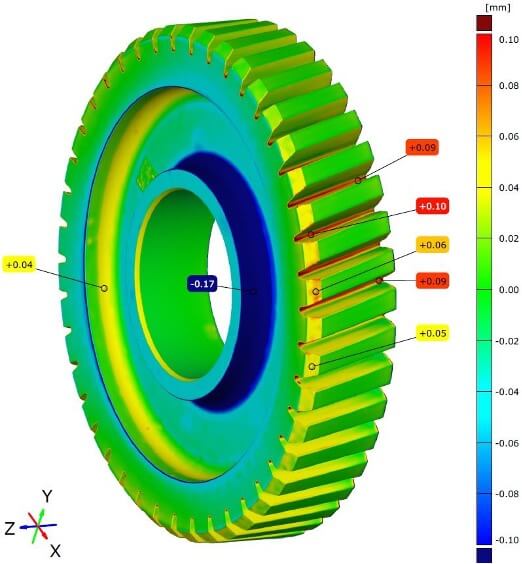
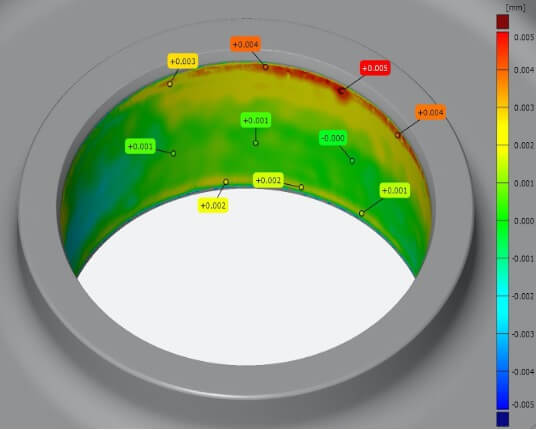
The image on the left shows the plot with a gradual colour change with green being close to nominal while red and blue indicate +/- material condition.
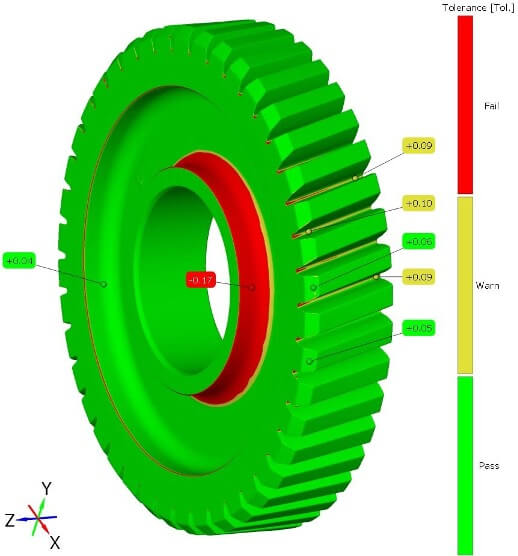
The image on the right shows a colour plot where a tolerance is applied to the nominal model which enables the generation of a pass or fail report which can be very powerful data to help the production team understand where their failure errors are occurring and supports the root cause analysis process. The level of detail contained in these reports is not possible using a CMM or tactile measurement system as the output from these processes are tables of data without the visual representation that you can see in the images above.
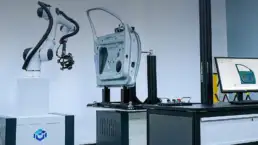
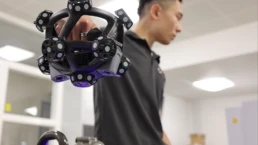
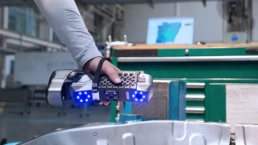
3D scanning systems have a further advantage over traditional CMM equipment as parts can be measured without the need for fixtures and the scanning system can be brought to the part rather than the part being brought to the measurement device and fixed into position. 3D scanning equipment is portable in most cases which enables components, machines, fixtures, tooling etc to be measured in situ and this is not possible for most traditional CMM equipment. Where parts require micron level accuracy or a highly monitored and repeatable process in a temperature stable environment, our facility can accommodate parts up to 3 metres in diameter and up to 2 tonnes in weight on the largest independent automated 3D scanning facility in the UK.
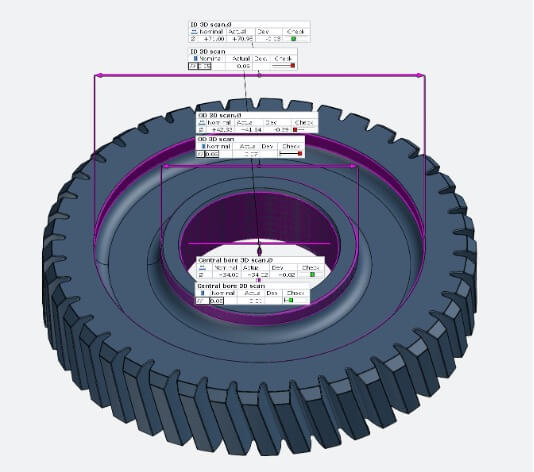
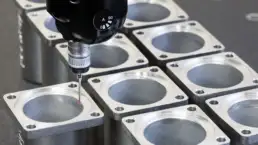
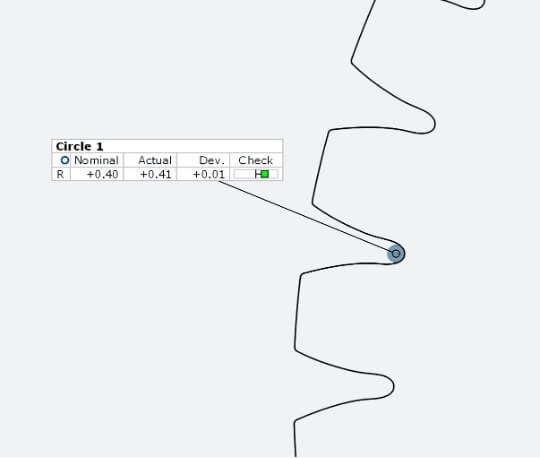
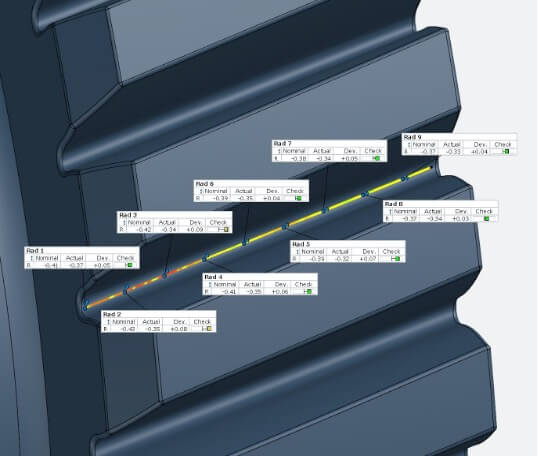
After the 3D scan data is captured, there are a range of inspection techniques contained within the system software which enable very sophisticated measurement possibilities. Several of these are demonstrated in the images below and these are measurements which would not be possible using a traditional tactile system.
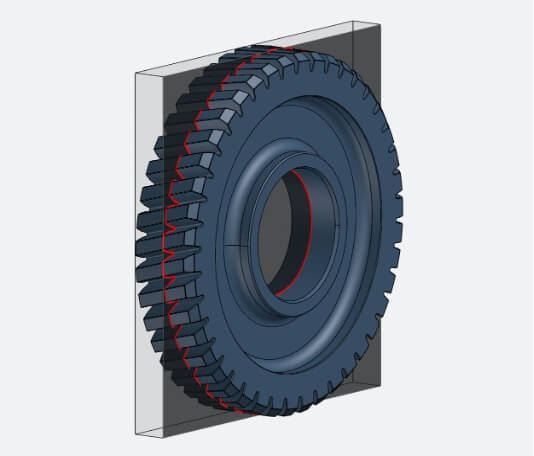
Here at The 3D Measurement Company we are regularly asked to compare 3D scan data with traditional CMM methods and to do this we have produced a range of reports to verify the scanning process and repeatability. The results from these studies show that T3DMC are producing accurate and fully traceable results to the same standard as high end CMM’s and to clearly demonstrate this, we have completed some measurements on a precision automotive gear with our 3D scanning system and then compared these results with a recognised CMM. The results from these measurements show that when both systems measure the geometric features of the gear they produced comparable values, however with the full surface data, there is more information available across the complete part which can help identify where there are variations to tolerance across the whole component and not just at the touch points measured by the tactile method.
Below are some images from this study: